
I’ve been measuring speaker performance ever since I washed-up at Mordant-Short in the early 1980s as a raw design graduate. One of the first things I learned was how to use a set of classic Brüel & Kjær acoustic measurement equipment comprising a measuring microphone, a combined oscillator/preamp/analyser (one of these) and a paper chart recorder (like this). Once warmed-up, the Brüel & Kjær kit could spit out wonderfully intuitive and revealing swept sine-wave frequency response and distortion charts. For all its slightly Heath-Robinson appeal though, Brüel & Kjær style swept sine-wave measurement had, and has, two big problems. First, it needs a large anechoic chamber to produce accurate results at low frequencies, and second, it reveals very little about a speaker’s time domain performance; how well the speaker starts and stops in response to an input signal.
The arrival of cost-effective computing power in the 1970s didn’t go unnoticed by loudspeaker engineers. One in particular, Laurie Fincham at KEF, realised that computers made possible recording a speaker’s response to a short impulse and then applying a Fourier transform to translate between time and frequency domains. This could not only generate the speaker’s ‘steady state’ frequency response, but also its frequency response at any time after the impulse. The resulting ‘waterfall’ plot, that illustrates how speakers go on ‘playing’ after an input signal has stopped, was a revelation. It was as if somebody had photographed the dark side of the Moon.
Time domain measurements were the beginning of the end for swept sine-wave techniques. The Time Delay Spectrometry technique devised by Richard Heyser was, for example, soon packaged up into the relatively affordable TEF acoustic measurement system. The real sea-change occurred however when Douglas Rife took Stanley Lipshitz and John Vanderkooy’s Minimum Length Sequence technique and created a comprehensive DOS based acoustic analysis package, christened MLSSA (pronounced Melissa). Suddenly, complex time domain based acoustic measurement was available to anybody with a PC and a couple of thousand dollars.
The one thing however that time domain based acoustic measurement lacked during its first couple of decades was a Mac based app. Windows users were well catered for with MLSSA and a couple of later competitors, but we Mac users for a long time had to borrow a PC or, as I did for a while, buy a cheap and clunky laptop just for the electro-acoustic stuff. That all changed however with the launch in 2004 of a neat little OS X app created by Chris Liscio called FuzzMeasure. FuzzMeasure uses an advanced mathematical technique called deconvolution to derive an impulse response from a fast sine sweep, which, again using a Fourier transform, can generate a variety of frequency domain data. One great advantage of swept-sine wave deconvolution over MLSSA’s minimum length sequence technique is that it can generate harmonic distortion data, something that MLSSA can only do in a somewhat clumsy spot frequency mode.
I first experimented with FuzzMeasure not long after it launched and have used it a on a few speaker design projects. I’m blogging about it now however partly because it’s recently been updated to Version 4 (4.1 in the last day or two), with numerous enhancements and improvements, but also because I’ve begun to use it to illustrate the nearfield monitor reviews I write for Sound On Sound magazine. The idea is not to use acoustic measurements to turn monitor reviews into dry technical appraisals, but to use measurements to illustrate aspects of interest in any particular monitor.
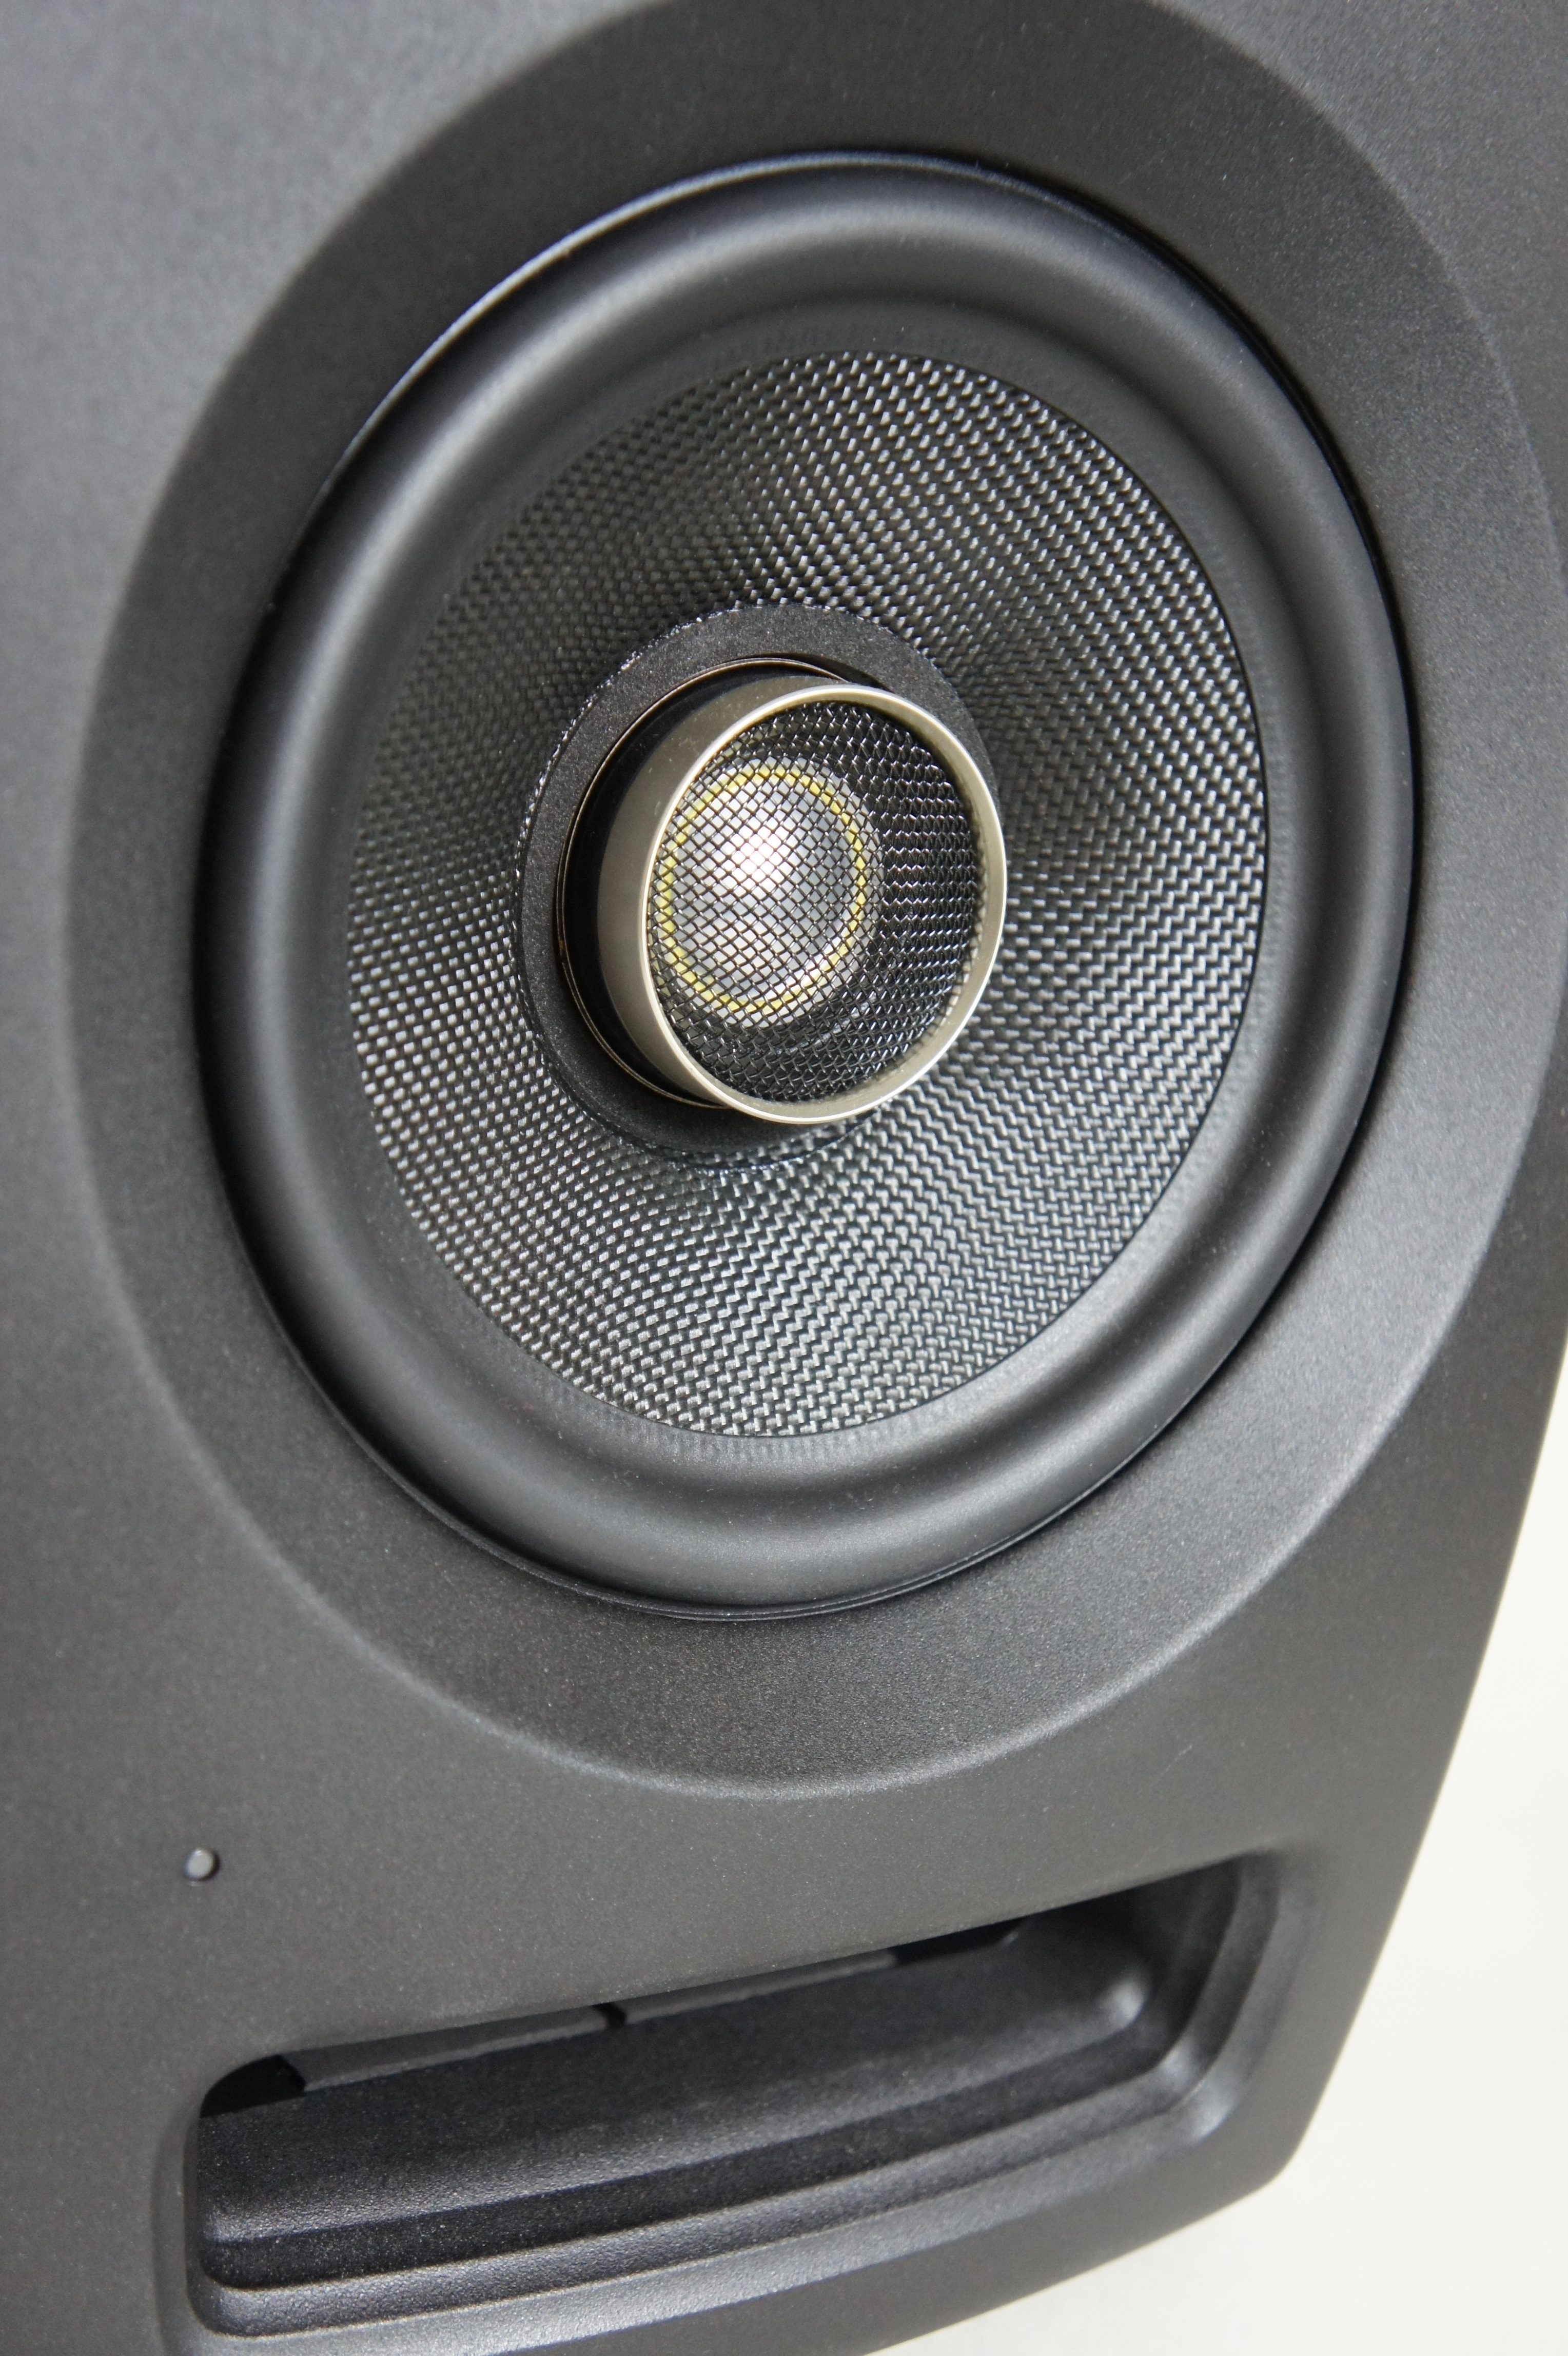
The first use of FuzzMeasure in a review was in the July 2016 piece on the Pioneer RM07. One interesting technical feature of the RM07 is the effort made to suppress port ‘organ pipe’ resonance, and I illustrated this in the review by using FuzzMeasure to generate port mouth response measurements of the RM07 and a not dissimilar, unnamed speaker (in which no apparent effort had been made to suppress those port resonances).
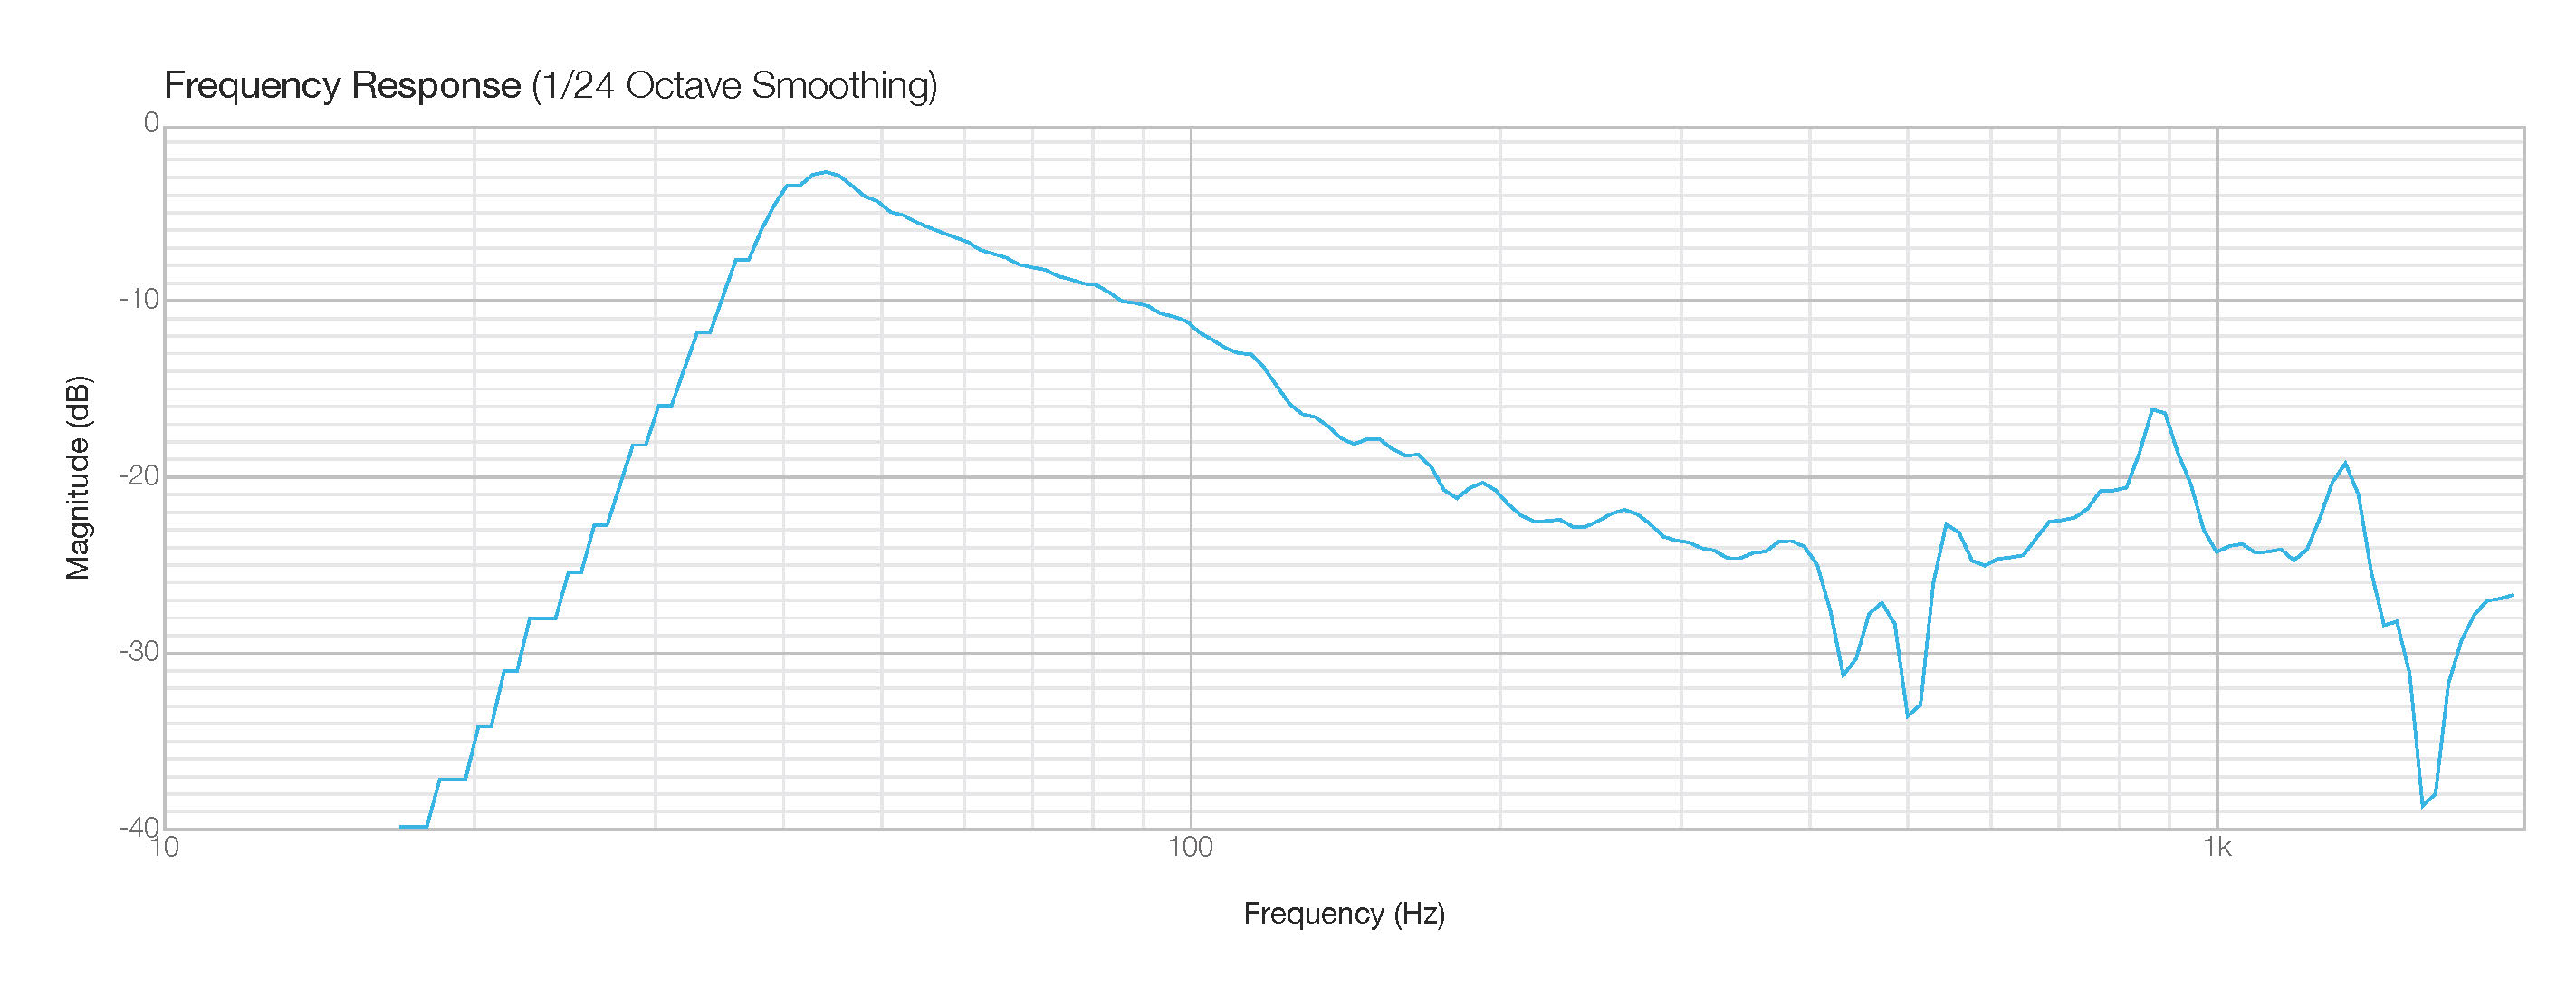
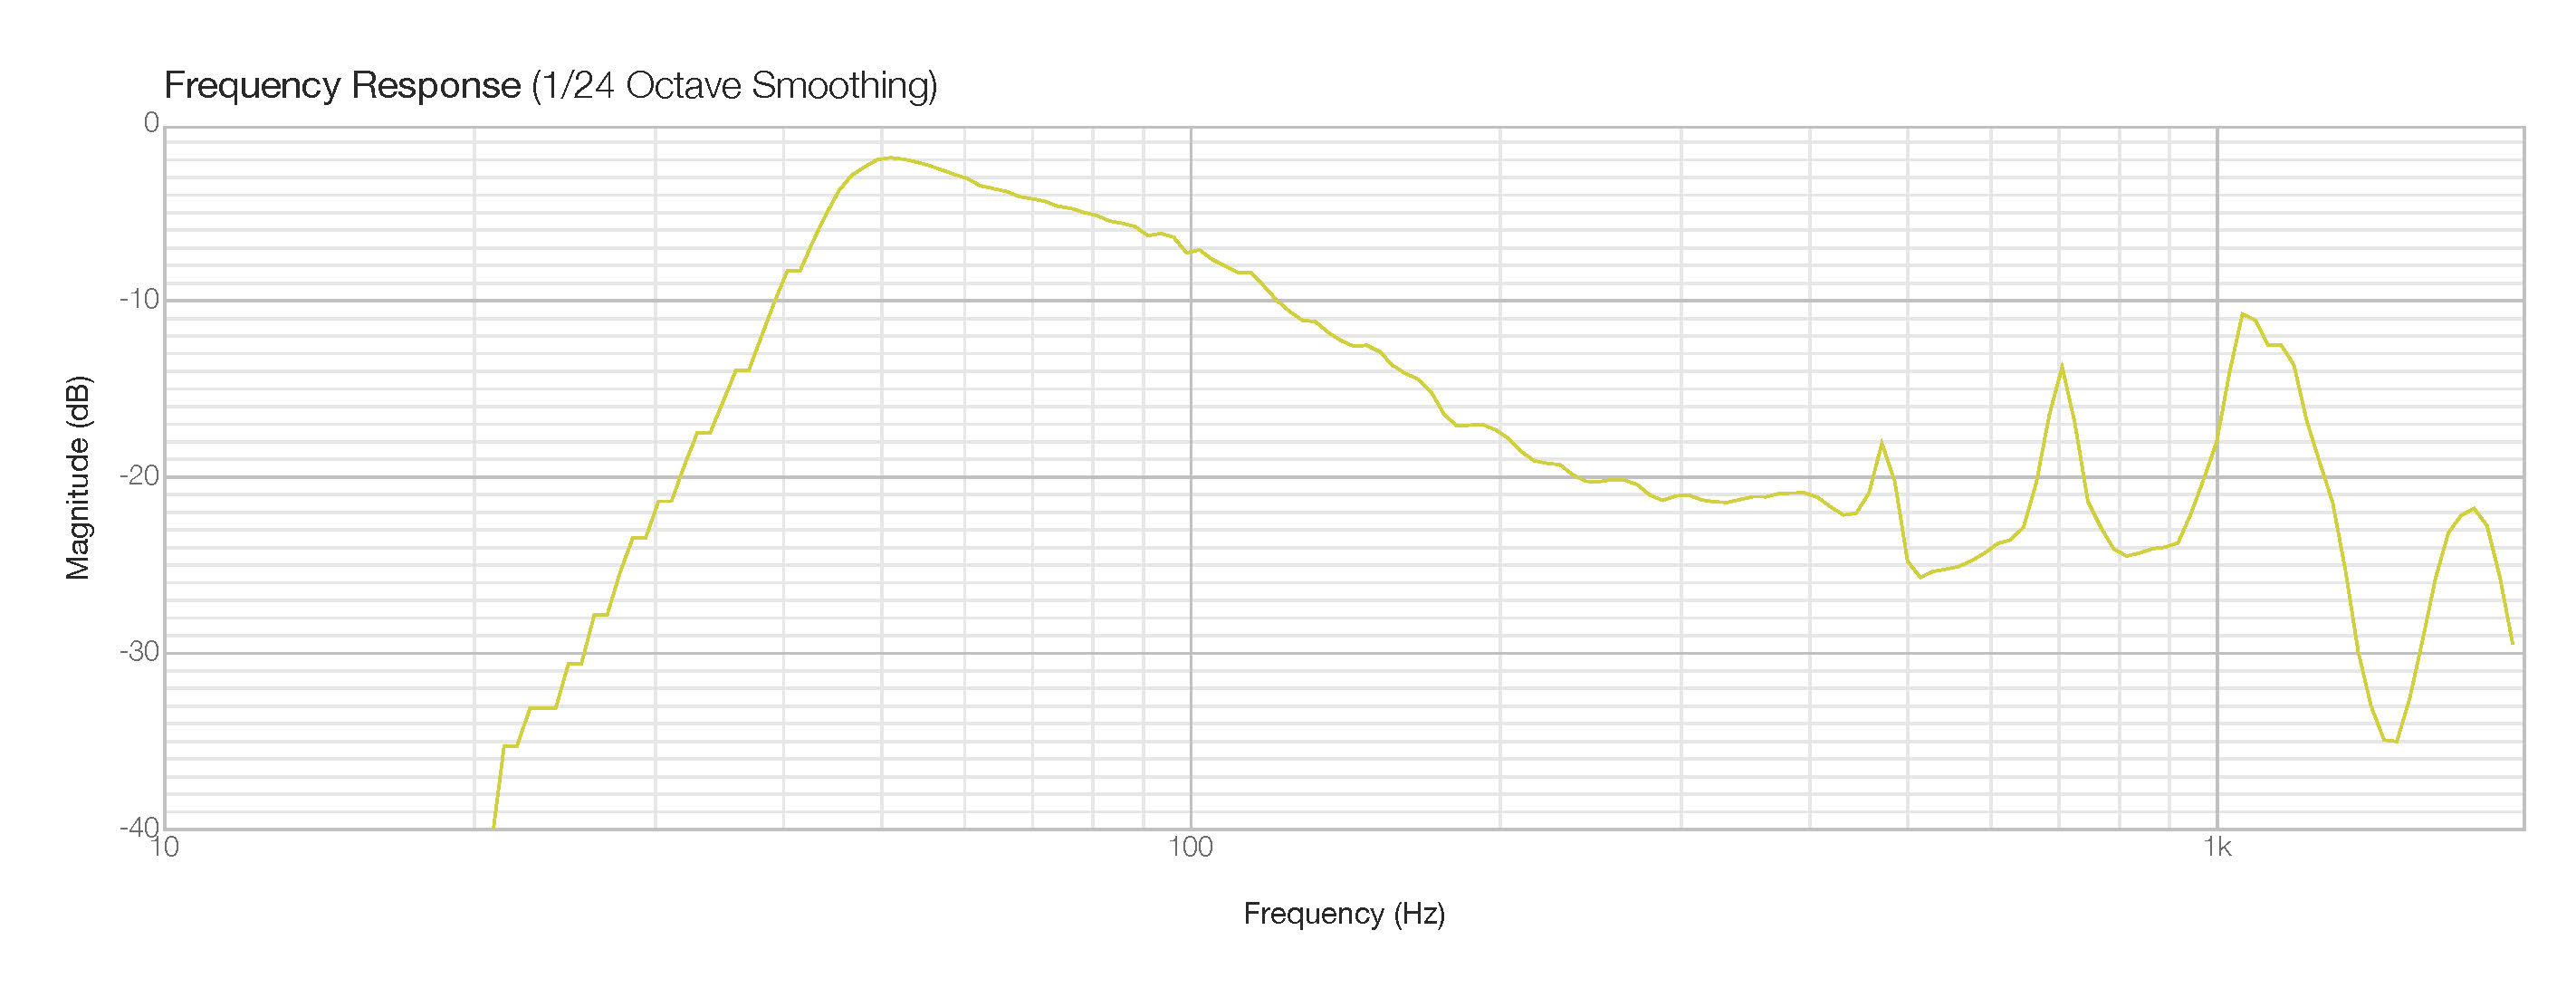
The first curve shows the Pioneer RM07’s well behaved port output. Apart from a couple of minor, potentially resonant features, the output decays slowly into noise. The second curve however shows that the port output of the unnamed speaker is characterised by a series of resonant features. While probably not being specifically audible, these features will likely add to the overall character of the speaker. It would be a better speaker if they were dealt with.
The delight of FuzzMeasure, apart from the fact that I don’t need a clunky old PC in order to do electro-acoustics, is the ease and simplicity it brings to measuring speakers. It made feasible the very idea of incorporating measurements in Sound On Sound monitor reviews.

Great article. Thanks. I’ve used FuzzMeaure for analyzing impulse responses and looking at RT60(and it’s variants) for large room acoustic studies and sound reinforcement tasks. I would upgrade to the latest version if my pocketbook would allow it. Maybe someday I will be able to upgrade.
LikeLike
Thanks Jeremy, glad you like the piece. Seems to me FuzzMeasure is a really cool app whatever version you have. So I wouldn’t lose to much sleep over not having the latest version.
LikeLike